Posts

Showing posts with the label logstash

Monitor WSO2 Carbon logs with Logstash
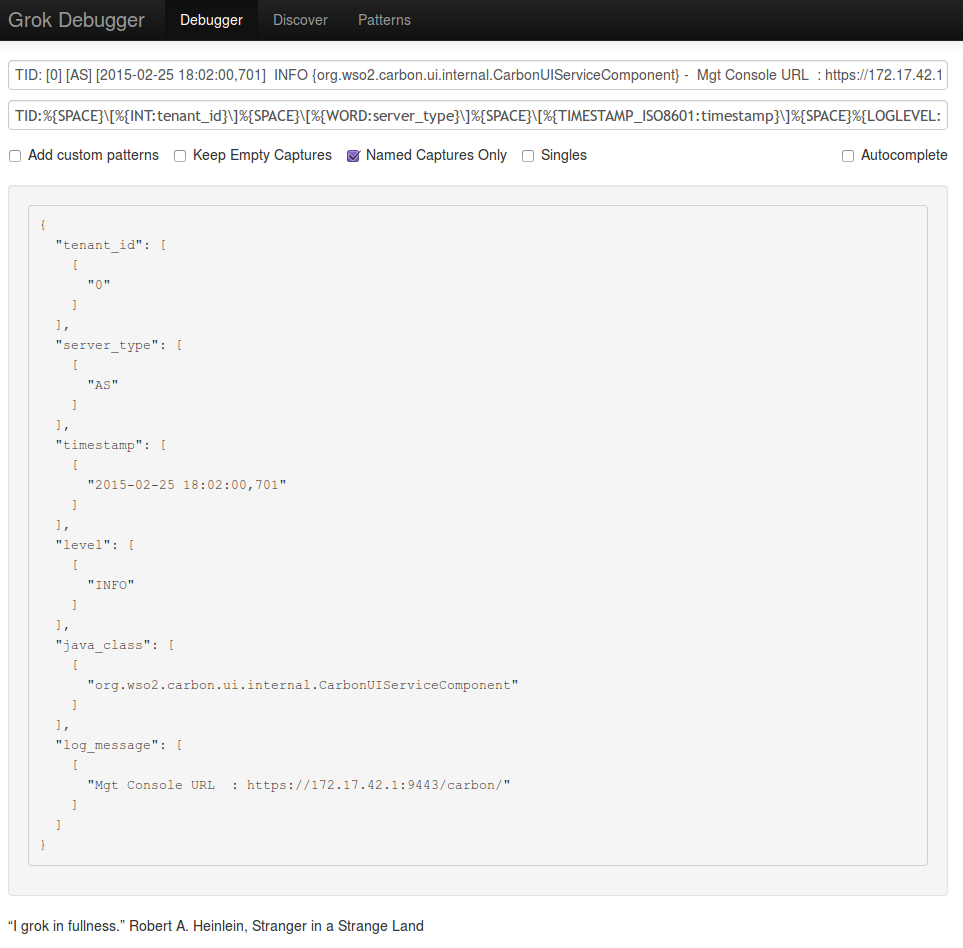
Image
The ELK stack  is a popular stack for searching and analyzing data. Many people use it for analyzing logs. WSO2 also has a full-fledged Big Data Analytics Platform, which can analyze logs and do many more things. In this blog post, I'm explaining on how to monitor logs with  Elasticsearch , Logstash and Kibana . I will mainly explain logstash configurations. I will not show how to set up Elasticsearch and Kibana. Those are very easy to setup and there are not much configurations. You can just figure it out very easily! :) If you want to test an elasticsearch server, you can just extract the elasticsearch distribution and start an elasticsearch server. If you are using Kibana 3, you need to use a web server to host the Kibana application. With Kibana 4, you can use the standalone server provided in the distribution. Configuring Logstash Logstash  is a great tool for managing events and logs. See  Getting Started with Logstash  if you haven't used ...

Monitoring WSO2 products with logstash JMX input plugin

These days, I got the chance to play with ELK  ( Elasticsearch , Logstash & Kibana ). These tools are a great way to analyze & visualize all logs. You can easily analyze all wso2carbon.log files from ELK. However we also needed to use ELK for monitoring WSO2 products and this post explains the essential steps to use logstash JMX input plugin to monitor WSO2 servers. Installing Logstash JMX input plugin Logstash has many inputs and the JMX input plugin is available under "contrib" We can use "plugin install contrib" command to install extra plugins. cd /opt/logstash/bin sudo ./plugin install contrib Note: If you use logstash 1.4.0 and encounter issues in loading the jmx4r, please refer Troubleshooting below. Logstash JMX input configuration When using the JMX input plugin, we can use a similar configuration as follows. We are keeping the logstash configs in "/etc/logstash/conf.d/logstash.conf" input { jmx{ path ...