Posts

Showing posts from February, 2015

Java Flight Recorder Continuous Recordings

When we are trying to find performance issues, it is sometimes necessary to do continuous recordings with Java Flight Recorder. Usually we debug issues in an environment similar to a production setup. That means we don't have a desktop environment and we cannot use Java Mission Control for flight recording. That also means we need to record & get dumps using command line in servers. We can of course use remote connection methods, but it's more easier to get recordings from the server. With continuous recordings, we need to figure out how to get dumps. There are few options. Get a dump when the Java application exits. For this, we need to use dumponexit and dumponexitpath options. Get a dump manually from JFR.dump diagnostic command via " jcmd " Note: The "jcmd" command is in $JAVA_HOME/bin. If you use the  Oracle Java Installation script for Ubuntu , you can directly use "jcmd" without including  $JAVA_HOME/bin in $PATH. Enabl...
Monitor WSO2 Carbon logs with Logstash

Image
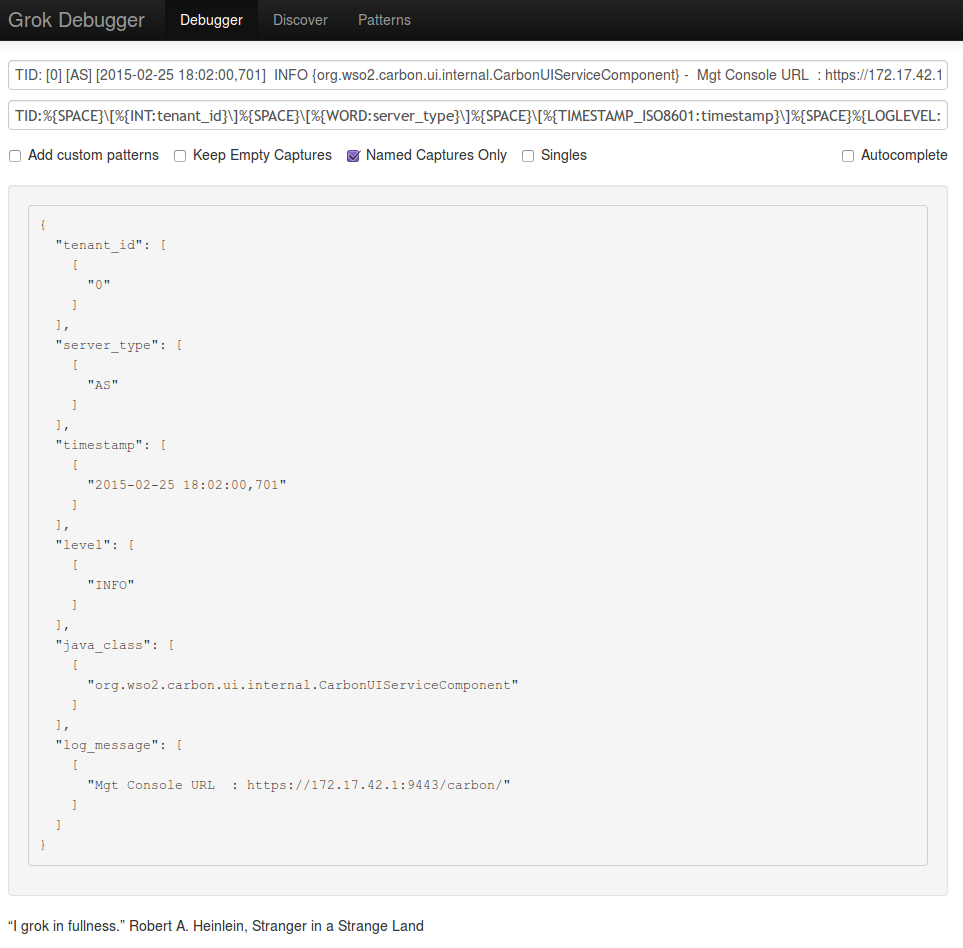
The ELK stack  is a popular stack for searching and analyzing data. Many people use it for analyzing logs. WSO2 also has a full-fledged Big Data Analytics Platform, which can analyze logs and do many more things. In this blog post, I'm explaining on how to monitor logs with  Elasticsearch , Logstash and Kibana . I will mainly explain logstash configurations. I will not show how to set up Elasticsearch and Kibana. Those are very easy to setup and there are not much configurations. You can just figure it out very easily! :) If you want to test an elasticsearch server, you can just extract the elasticsearch distribution and start an elasticsearch server. If you are using Kibana 3, you need to use a web server to host the Kibana application. With Kibana 4, you can use the standalone server provided in the distribution. Configuring Logstash Logstash  is a great tool for managing events and logs. See  Getting Started with Logstash  if you haven't used ...